SaaSMarketing on the InternetSoftware DevelopmentIT strategy12 min czas czytania15 067 znaków2282 słowa
Freemium or free trial? The SaaS subscription model in numbers
Freemium, trial without a card, or trial with a card: ChartMogul conversion data, time-to-value, churn, MRR, LTV:CAC and European cloud adoption from Eurostat.

Redakcja Digital VantageYour Partner in Business, Digital Vantage Team · Digital Vantage team is a group of experienced professionals combining expertise in web development, software engineering, DevOps, UX/UI design and digital marketing. Together we carry out projects from concept to implementation - websites, e-commerce stores, dedicated applications and digital strategies.
Our team combines years of experience from technology corporations with the flexibility and immediacy of working in a smaller, close-knit structure. We work in agile methodologies, focus on transparent communication and treat each project as if it were our own business.
The strength of the team is the diversity of perspectives - from systems architecture and infrastructure, frontend and design, to SEO and content marketing strategy. As a result, the client receives a cohesive solution where technology, aesthetics and business goals go hand in hand.
Publikacja
Aktualizacja
Freemium, a free trial, a trial that requires a card — the choice between them usually gets settled by borrowed anecdotes. "Freemium builds reach." "A card scares people off." "Over 60% of people who try it become customers." The first two claims are only half true. The third one simply isn't true.
There are measurements, though. This article is built on data that can be checked — ChartMogul reports, Eurostat figures, and metric definitions — and next to every number it says what that number is worth and what limits it. We look at how the three funnels differ, which metrics actually decide the model, and what any of this means for a product sold on the Swiss market.
Five numbers worth starting with
- Cloud adoption has to be read by category, not as a single number: in Europe, e-mail and office software in the cloud are far more common than database hosting or raw computing power.
- For Switzerland, there's no official statistic comparable to the European figure for paid cloud adoption — we explain why further down, rather than invent a Swiss number.
- Median free-to-paid conversion: 8% — with a wide spread rather than a cluster around the middle (ChartMogul and ProductLed, 200 B2B products, January 2026).
- A payment card changes everything: a trial that requires a card converts around 30%, more than five times the rate without one (same report).
- Price limits expansion: only 2% of companies on a subscription under $25/month grow revenue from existing customers above 100% (ChartMogul, data to March 2023).
Market: what cloud adoption shows in Europe — and what we don't know for Switzerland
Start with a number nobody has a stake in, because nobody's selling anything with it. According to Eurostat (dataset isoc_cicce_use), in 2025 52.7% of EU enterprises with at least 10 staff bought paid cloud services. That's a European figure, not a Swiss one: Eurostat doesn't cover Switzerland, and no comparable official Swiss statistic exists. The only Swiss survey on the subject (BFS/KOF, 2019) covers firms with 5 or more staff and measures adoption of any cloud solution in general, not paid purchases by firms with 10 or more staff — the two figures aren't comparable.
What this figure does reveal is its structure — and that structure is likely to hold elsewhere in Europe, Switzerland included. By company size: small firms 49.3%, medium 66.8%, large 84.7%. Large enterprises are close to the ceiling. The room to grow sits with small firms, where a single person makes the buying decision — and that's the first argument for self-service models, in which the customer signs themselves up and talks themselves into the purchase.
Structure matters more than the total
It gets more interesting once you break the total down by service. E-mail in the cloud runs at 44.9% of EU enterprises, office software at 37.8%, file storage at 37.7% — then a sharp drop to database hosting at 24.0% and raw computing power at 14.9% (Eurostat, 2025).
That gap tells you something useful for SaaS marketing: categories that behave like everyday software — mail, office tools, file storage — are adopted far more widely than infrastructure-level services such as hosted databases and compute. A buyer you're chasing in one of those lagging categories is often not comparing vendors yet; they're still deciding whether the problem is worth paying to solve at all. You're not usually taking them from a competitor — you're selling the category before you sell the product. And that changes which funnel makes sense: a buyer who doesn't know the category yet needs time to see the value before they'll pay for it.
For scale, the global picture: in February 2026 Gartner forecast worldwide end-user spending on public cloud at around $850 billion for 2026. That's a forecast, not a result — and IT spending forecasts are updated during the year, so treat this figure as an order of magnitude from a given date, not a constant. It describes the world, not Europe or Switzerland specifically.
Freemium, free trial, trial with a card — three different funnels
Definitions first, because marketing material tends to blur these together:
- Freemium — a free version of the product with no time limit, restricted by features, seats, or usage volume. The customer pays once they hit a limit or need a paid-plan feature.
- Free trial without a card — a full or near-full product for a set period, usually 7–30 days, with no payment details taken. When it ends, the customer has to actively decide to buy.
- Trial with a card — the same, except a card is taken at sign-up, and the subscription rolls into a paid one when the trial ends unless the customer cancels.
The measurement worth building on is the SaaS Conversion Report from ChartMogul, produced with ProductLed: 200 B2B products, surveyed in January 2026. One caveat up front, because it matters: this is data companies self-reported in a survey, not a read-out from their own systems, and the typical respondent has $1–10 million in annual revenue. Treat it as an order of magnitude, not an oracle.
The median free-to-paid conversion rate in this study is 8%. But the median alone says little, because the spread is enormous: a fifth of products (20%) convert below 2.5%, and roughly a quarter (23%) convert above 25%. The remaining 57% sit in a band where the best performer converts ten times better than the weakest.
Free-to-paid conversion — a wider spread than the median suggests
ChartMogul and ProductLed, SaaS Conversion Report, January 2026, read 30 September 2026
A payment card splits the market in two
The single strongest relationship in this report: a trial that requires a card converts around 30% — more than five times the rate of a trial without one. The report also gives bands it considers good and great: for a card-gated trial, good is 25–35% and great is 50–60%; for a trial without a card, good is 4–6% and great is 10–15%. Quoting "trial conversion" without saying whether a card was required, in other words, tells you nothing.
Conversion alone is a poor way to compare the two, though, because each model measures a different point in the funnel. A fair comparison starts from the same number of visitors. Per 1,000 site visits, the report shows roughly:
- freemium — around 90 sign-ups, of which roughly 5 pay;
- trial without a card — roughly 3–4 paying customers;
- trial with a card — only around 35 sign-ups, but roughly 10–11 paying customers.
Three SaaS funnels per 1,000 visits
ChartMogul and ProductLed, SaaS Conversion Report, January 2026, read 30 September 2026
This flips the advice you hear most often. Less friction doesn't automatically win — the card-gated variant produces the most paying customers from the same traffic, even though fewer than half as many people sign up. A card works as a filter: it screens out the curious before they start costing you support time and infrastructure.
So the choice isn't a matter of taste — it's a matter of what you're short of. If your traffic is limited and every registered contact is valuable, the card-gated variant turns that traffic into customers most efficiently. If you're building reach, a network effect, or a user base you can talk to about the product, freemium gives you a far larger population — you just need to know what that population is for and what it costs to keep.
One warning about numbers that circulate without a source. The claim that "over 60% of people on a trial become customers" turns up often — it's higher than even the "great" band for a card-gated trial. If you see a figure like that in someone else's material with no methodology attached, it usually means something else was counted — conversion among people who completed the entire onboarding flow, for instance.
Example: freemium and a trial at once, in DVN Links
These models aren't mutually exclusive. In our own product, DVN Links — a European link management platform with analytics and QR codes — we combined both. The free plan needs no card and has no time limit, but it has hard limits: 50 links and 1,000 clicks a month, 7-day statistics, and no API access. The Pro plan, at PLN 79 a month, comes with a 7-day trial.
The split of roles is straightforward. Freemium is the wide funnel: someone shortening a handful of links a month can stay with us for years without paying, and get to know the product with zero risk. The Pro trial is for people who already know what they're after — 90-day analytics, QR codes with a logo, an API for creating links automatically — and want to test it on their own data before they pay. Every limit on the free plan doubles as a natural reason to upgrade.
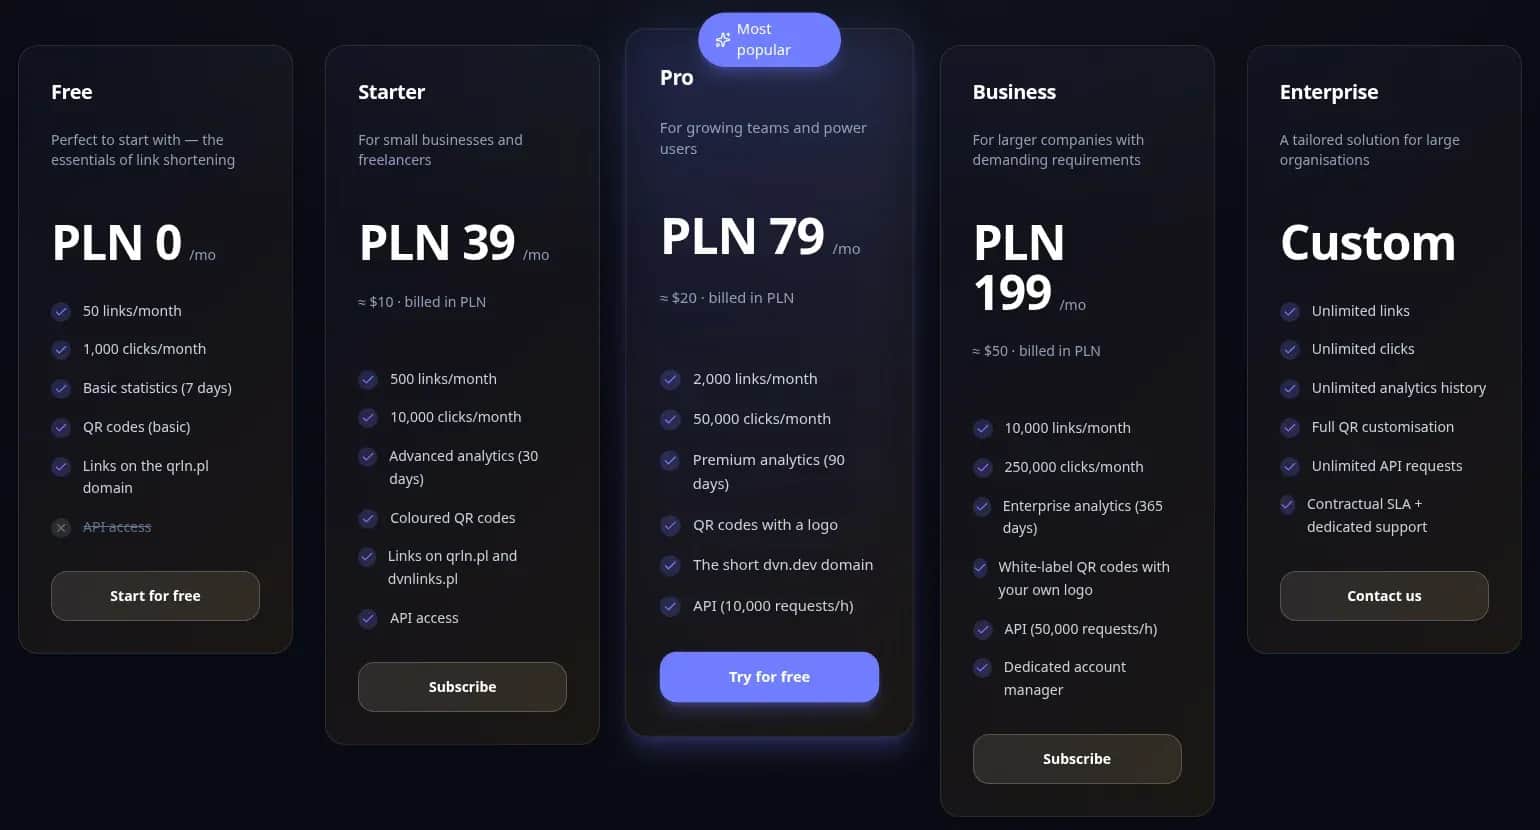
DVN Links pricing — a card-free free plan and a Pro trial
dvnlinks.pl/en, screenshot of 30 September 2026
Time-to-value: why the same model works for one product and not another
Between sign-up and payment, there's one moment that decides everything: when the user first sees the product deliver value on their own data — the first invoice raised, the first report, the first task done automatically. The time from sign-up to that moment is called time-to-value (TTV), and the moment itself — in product-led-growth terms — is the "aha moment": Amplitude defines it as the point at which "a user grasps and internalizes your product's core value proposition" (Amplitude).
This concept is what ties the funnel to the metrics. In a trial, the clock runs from sign-up: if the product only shows its value after two weeks of setup, and the trial lasts fourteen days, the user will decide whether to buy before they've seen anything. In freemium, the clock isn't limited, but attention is — a user who doesn't hit value in their first session usually doesn't come back. Either way, shortening the path to that first payoff beats switching models.
The practical rule: before you swap freemium for a trial, or the other way round, measure how much time and how many steps a new user needs to reach that first payoff. If it's days rather than minutes, no funnel model will fix that — you need to shorten onboarding first, with sample data, templates, or an import from whatever tool the customer used before.
The metrics that decide the model: MRR, churn, LTV:CAC
Conversion tells you how many people started paying. Three other numbers decide whether the subscription model actually works.
MRR — monthly recurring revenue
MRR (monthly recurring revenue) is, per ChartMogul's definition, the normalised, predictable revenue a subscription business expects each month from active customers, excluding one-off fees (ChartMogul, MRR). An annual subscription of CHF 1,200 counts as CHF 100 in MRR each month, and an implementation fee doesn't count at all. MRR is the baseline, because it shows what the company earns "on autopilot", before it sells anything new.
Churn — losing customers, and losing revenue
Customer churn (also logo churn) is the share of paying customers a company loses in a given period (ChartMogul, customer churn). Revenue churn is the rate at which a company loses recurring revenue to cancellations and downgrades (ChartMogul, revenue churn). These are two different numbers: a company can lose many small customers and little revenue, or the reverse. Net revenue churn can even go negative, when upsell to existing customers outweighs the losses.
A simple calculation shows why churn matters more than conversion. Take a company — an illustration, not market data — with MRR of CHF 10,000 that adds CHF 1,000 of new MRR every month. At 2% monthly revenue churn, after a year it has roughly CHF 18,600 in MRR. At 6% churn, roughly CHF 13,500. Same sales, same conversion rate, and revenue a year later is more than a quarter lower.
How churn eats into MRR — a worked example
Digital Vantage worked example
LTV:CAC — what a customer is worth, and what they cost
LTV (lifetime value) is the revenue an average customer brings in over the whole relationship; in its simplest form, average monthly revenue per customer divided by monthly churn. CAC (customer acquisition cost) is the cost of winning one customer — marketing and sales spend divided by the number of new customers. The ratio of LTV to CAC tells you whether acquiring customers pays off; the industry often cites 3:1 as a reference point (Baremetrics) — a rule of thumb, not a standard.
This is where the funnel choice comes back into view. Freemium usually lowers CAC (users show up on their own) but raises the cost of supporting free accounts. A card-gated trial raises friction at the door but delivers customers who chose to pay with their eyes open. Only setting CAC against churn shows which model produces the healthier business for your product.
Retention is a function of price, not just support quality
Customer retention gets described as a support team's job. That's only half true. In its SaaS Benchmarks Report, ChartMogul pooled subscription data from more than 2,100 companies and found a relationship that outweighs anything a support team can do: the ability to grow revenue from existing customers depends above all on price level.
In that data, among companies with average revenue per account above $1,000 a month, close to half hold net revenue retention above 100% from their existing base — meaning they grow without acquiring new customers. Among companies below $25 a month, 2% manage that.
The consequence for a cheap product is uncomfortable, but worth knowing: you can't offset churn with upsell, because at a low subscription price there's nothing to upsell in amounts that would cover it. That leaves three levers — cut acquisition cost, raise prices, or narrow the target audience to one that will pay more. Growing the support team won't reverse it on its own.
One caveat on these figures: the data runs to March 2023. We're using it to describe the structure — the relationship between price and room to expand — not the current level of the market.
Content marketing: you're selling the category, not the features
The Eurostat data showed that adoption in Europe drops off sharply the further a category sits from everyday office tools. There's no equivalent Swiss statistic, but the mechanism has every reason to hold in Switzerland too: in those still-lagging categories, the typical buyer usually isn't comparing vendors yet — they're still deciding whether the problem is worth the spend. Content that jumps straight to competitive advantages misreads that stage.
The reverse order works better: first name the cost the customer is already paying without seeing it on an invoice — hours spent re-keying data by hand, order mistakes, evenings lost to paperwork. Only then does the tool appear, as the answer to that cost. It's also the only way content marketing becomes measurable at all: you track not traffic but the share of enquiries in which people describe the problem in your own words on the form.
AI and automation — what's real, and what's a promise
Automated communication has stopped being a differentiator and become the expected baseline: audience segmentation, messages triggered by in-product behaviour, onboarding prompts. It's worth separating two things that marketing material usually bundles together.
The first is rules-based automation — send a message when a user hasn't come back in five days. It behaves predictably, ships in a few days, and its effect can be measured with an A/B test. The second is language models generating content and recommendations. They're useful, but their effect on sales is harder to isolate, and running costs grow with traffic. The honest order: rules first, because they're cheap and measurable, then models — if there's a problem left that rules can't solve.
Three mistakes that cost the most
Measuring conversion without naming the model. Comparing your own number against an industry average without checking whether you're comparing the same model leads to wrong conclusions in both directions. A 10% rate on a trial without a card is a great result; on a trial with a card, it's weak. Same number, opposite verdicts.
Treating sign-up volume as the result. Sign-ups are easy to inflate and easy to put on a slide. The funnel data shows, though, that the model with the most sign-ups isn't the model with the most customers. If you're reporting sign-ups instead of paying customers, you're optimising a number that doesn't pay the bills.
Counting on upsell at a low price. A "get in cheap, upsell later" plan is realistic above a certain price point and nearly impossible below it — only 2% of companies on a subscription under $25/month achieve positive expansion. If your model assumes you'll be in that 2%, write that down explicitly as a risky assumption, not as a plan.
How to read SaaS benchmarks
For any number in someone else's material, it's worth checking four things: what year it's from, who collected it, whether it comes from live systems or a survey, and what the typical company size in the sample was. A benchmark from companies with $1–10 million in revenue doesn't describe a product that's just launching, and a self-reported survey figure tends to run high, because nobody advertises a weak conversion rate.
Two traps came up while preparing this article. The first is forecasts: IT spending forecasts are updated during the year, so a figure quoted in February may be out of date a few months later — check the date of the release. The second is second-hand numbers: exact conversion rates attributed to reports often don't appear in the report itself — the report gives ranges instead. That's why every number in this article carries a source and its limitation next to it. If one of them ends up in your own deck, carry the caveat along with it.
If you're building a product from scratch, we've collected a list of narrow niches with the reasoning behind each one in Micro-SaaS ideas. The fundamentals of the model are covered in our guide to SaaS.
Sources
Eurostat — Cloud computing services used by enterprises (isoc_cicce_use), 2025 data
ChartMogul / ProductLed — SaaS Conversion Report, January 2026 (200 B2B products, survey)
ChartMogul — SaaS Benchmarks Report (subscription data from 2,100+ companies, period to March 2023)
ChartMogul — definitions of MRR, customer churn and revenue churn
Gartner — IT and public cloud spending forecast for 2026, February 2026
FAQ
Frequently asked questions about freemium and the subscription model
Freemium is a model where the base version of a product is free with no time limit, and you pay for extended features, greater scale, or more seats. It differs from a free trial in that the free version never expires — the customer only moves to a paid plan once they hit the free plan's limit.
It depends on what you're short of. According to ChartMogul's SaaS Conversion Report, a card-gated trial produces the most paying customers from the same number of visits, while freemium produces the most sign-ups. Freemium makes sense when you're building reach or a network effect and the product shows value fast; a card-gated trial makes sense when traffic is limited and every contact is valuable. Either way, the time to first value (time-to-value) is what matters most.
Customer churn is the share of paying customers lost in a given period: the number of customers who cancelled during the month, divided by the number of customers at the start of the month. Revenue churn measures the same thing in money — recurring revenue lost to cancellations and downgrades, against revenue at the start of the period.
MRR (monthly recurring revenue) is a subscription business's normalised, predictable monthly revenue from active customers, excluding one-off fees. An annual subscription is divided by 12; implementation fees aren't counted at all.
Building a SaaS product?
We'll help you design onboarding that shortens the path to first value, and measurement that shows whether your funnel is actually working.
Related Posts
- SaaS — what it is and when subscription software makes sense for a business
What SaaS is: software as a service by NIST's definition, real business examples, SaaS vs in-house software, and when a subscription pays off.
- 1.Cloud computing — what it is and how IaaS, PaaS and SaaS differ
Cloud computing by the NIST definition: five traits, IaaS, PaaS and SaaS, public, private and hybrid cloud, and how businesses actually use the cloud.
- 2.Micro-SaaS examples 2026 — 35 niche tools you could build
35 micro-SaaS examples grouped by industry, a niche-scoring framework, a 30-day MVP plan, and Swiss VAT for selling abroad.
- 3.Cloud security: who's responsible for what, and what to ask your provider
Cloud security explained: shared responsibility, the processor contract, US data transfers, Switzerland's Information Security Act and your cloud exit strategy.
- 1.
About the Team
Digital Vantage Team
Your Partner in Business, Digital Vantage Team
Digital Vantage team is a group of experienced professionals combining expertise in web development, software engineering, DevOps, UX/UI design and digital marketing. Together we carry out projects from concept to implementation - websites, e-commerce stores, dedicated applications and digital strategies. Our team combines years of experience from technology corporations with the flexibility and immediacy of working in a smaller, close-knit structure. We work in agile methodologies, focus on transparent communication and treat each project as if it were our own business. The strength of the team is the diversity of perspectives - from systems architecture and infrastructure, frontend and design, to SEO and content marketing strategy. As a result, the client receives a cohesive solution where technology, aesthetics and business goals go hand in hand.